Inference Serving: Optimize the Request Path Before Buying More GPUs
Measure scheduling, cache pressure, prefill interference, and host overhead before expanding inference capacity.
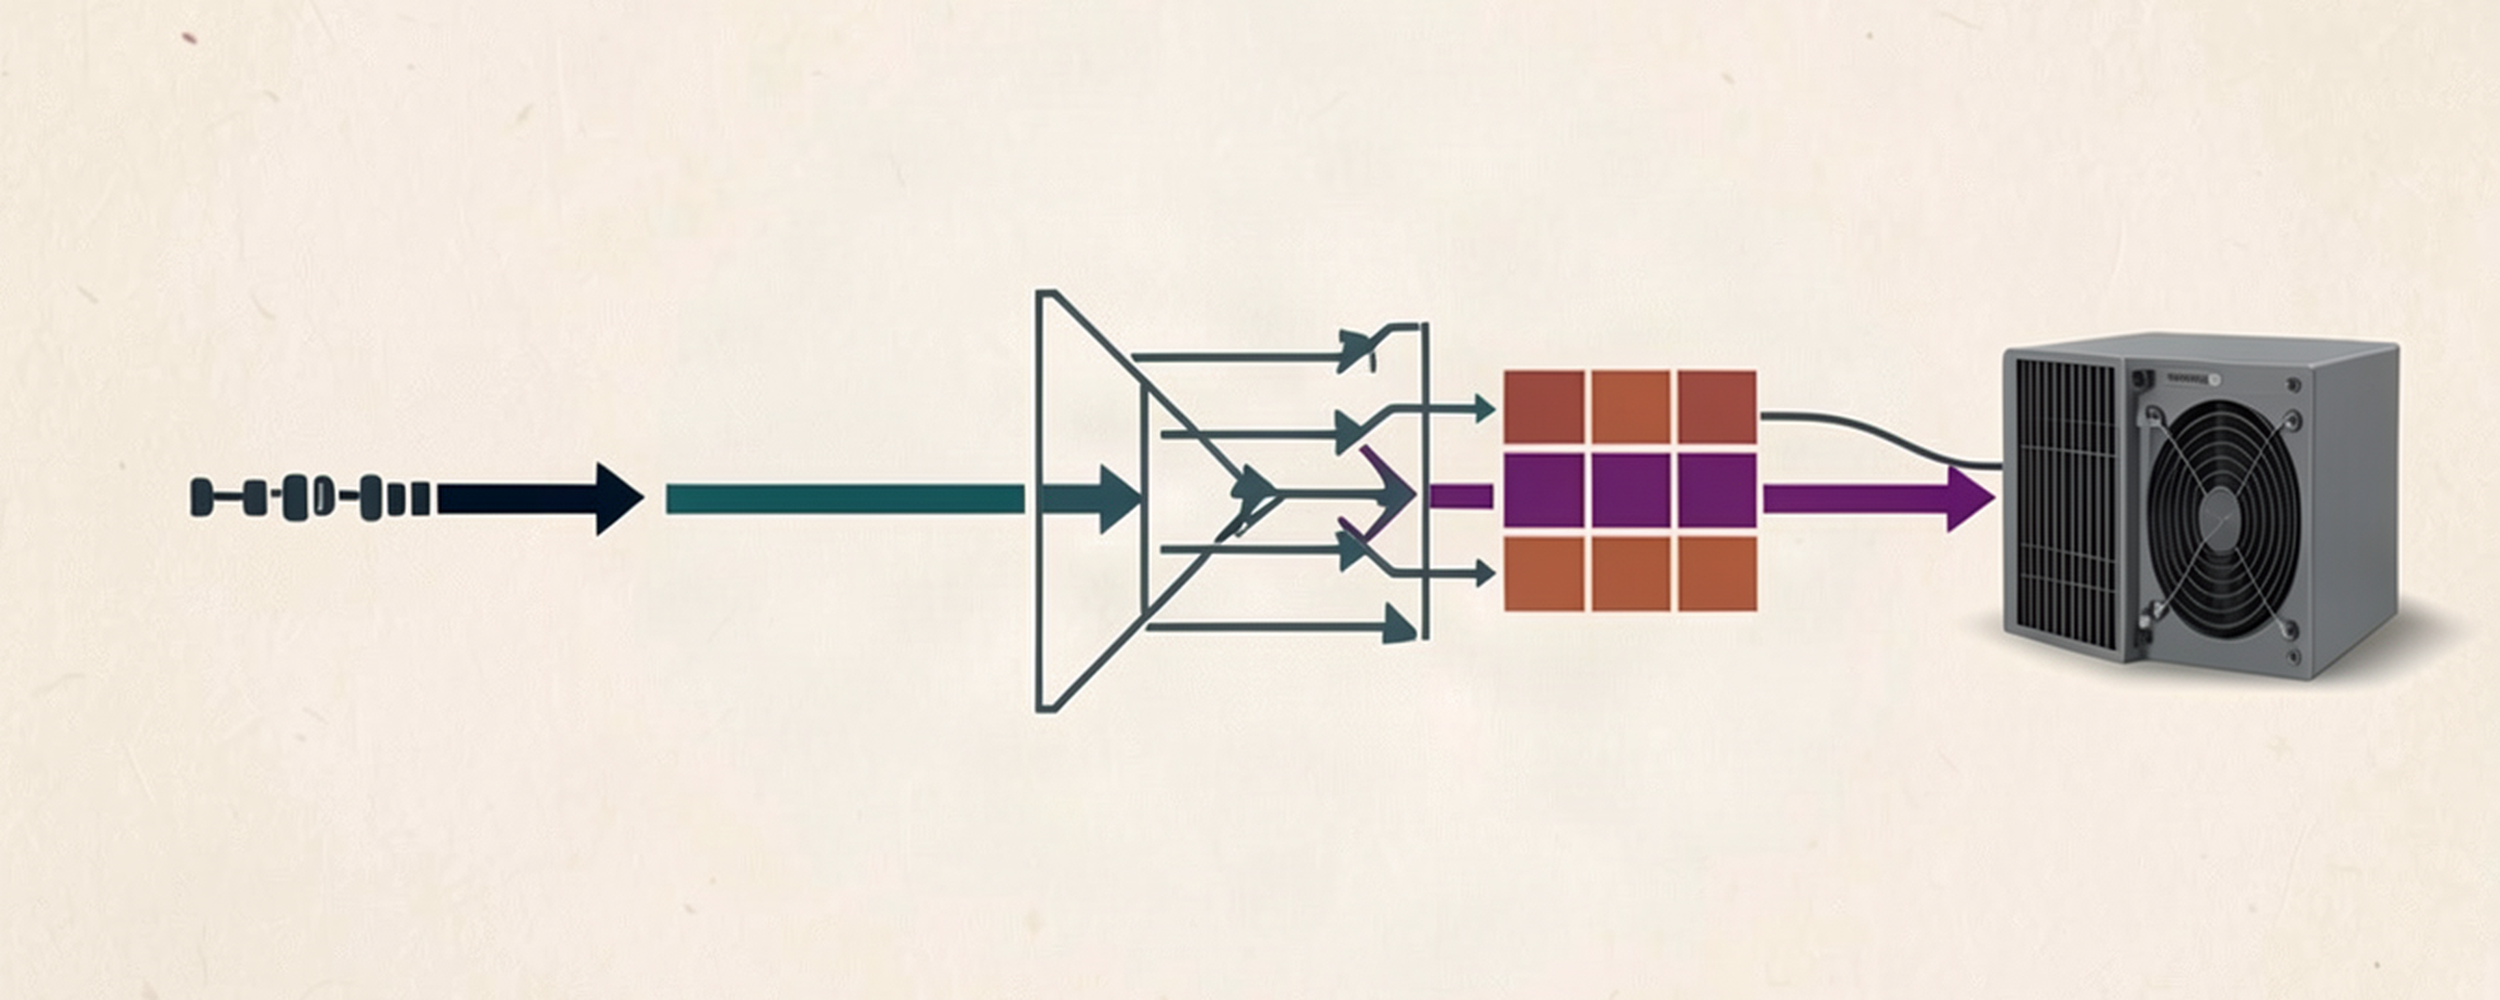
A serving endpoint can have requests waiting while its GPU still has room for useful work. Continuous batching addresses one cause: requests finish at different iterations, and a static batch cannot immediately replace the finished ones.[2] Buying another accelerator before understanding that queue risks paying for the same scheduling problem twice.
The useful networking analogy is resource admission, not a utilization target. Ask which work can enter, what state it must retain, and which requests wait behind it. Then optimize for completed requests within a latency objective. A busier device is evidence to investigate, not proof of a better service.
The decision rule is to trace the request path before changing capacity. Separate admission, cache pressure, prefill interference, and host-side overhead. This article uses published implementation details and historical benchmarks, not a new measurement of my single-node machine. The recommendations below are a test framework, not promised speedups.
The implementation guidance concerns vLLM V1 serving autoregressive text-generation requests.[1] Check feature support and defaults against the installed release: the linked stable and latest documentation are moving references, not a compatibility guarantee. Distributed topology, multimodal preprocessing and availability sizing are outside this framework. No engine release was benchmarked for this article.
Continuous batching changes when work can enter
Autoregressive generation proceeds iteratively.[2] In a static batch, shorter completions leave unused opportunities while longer requests finish.[2] Continuous batching makes admission decisions between iterations, allowing a new request to join without waiting for every existing request to complete.[2]
Think of statistical multiplexing, with an important limitation: a request is not a packet that disappears after transmission. Its attention state remains resident across subsequent generation steps.[4] Scheduling and memory allocation must cooperate, which is why a batch-size setting alone does not describe serving capacity.[2][4]

Figure 1. Continuous batching can reuse a finished request's place at an iteration boundary. This schematic omits prefill cost and does not predict throughput. Original illustration based on Anyscale's scheduling explanation.[2]
Anyscale's June 2023 comparison reported up to 8× throughput over naive batching from continuous batching, and up to 23× when using vLLM with additional memory optimizations.[2] Those compare different serving implementations against the same naive-static baseline.[2] Calling the larger figure a pure scheduler improvement erases part of the mechanism.
The experiment varied output-length distributions and used a burst submission for its throughput test; its latency experiments used separately controlled arrival patterns.[2] These details matter more than the headline multiplier. A workload with uniform short responses offers a different scheduling opportunity from a mixture of brief answers and long generations.
For a local evaluation, preserve the prompt and output distributions, including their relationship. Do not compare a serial client against a concurrent client and attribute the entire difference to the engine. Record offered request rate independently of completed throughput. When the server falls behind, keep counting rejected, cancelled, and timed-out requests rather than quietly removing them from the result.
PagedAttention recovers cache space, not a fixed share of compute
The original vLLM engineering report identified 60–80% memory waste in the systems it examined, caused by fragmentation and over-reservation.[4] That is a memory-management finding, not evidence that every GPU wastes that percentage of compute. The distinction changes the diagnosis: recovering cache space helps admission only when cache capacity is the limiting resource.
PagedAttention divides each sequence's key-value cache into fixed-size blocks.[4] A block table maps logical sequence positions to physical blocks that need not be adjacent, and the engine allocates physical blocks as the sequence grows.[4] This avoids reserving one contiguous region for the entire possible sequence at arrival.[4]
The original report described residual waste below 4% in its evaluated setting, concentrated in a sequence's final block.[4] Treat that as an attributed historical result, not a guarantee for all memory consumed by a modern serving process. Model weights, execution buffers, and other allocations are outside that particular claim.
Current vLLM guidance documents the next failure mode: when the KV cache cannot hold the active work, the engine can preempt requests and recompute their state later, increasing end-to-end latency.[1] A server can therefore remain busy while spending effort recovering work instead of finishing more useful requests.
Before increasing concurrency, watch cache occupancy and preemption alongside queue delay. If preemptions rise, first test a lower active-sequence limit. Compare that with increasing the cache memory allocation only where measured headroom permits. vLLM also documents reducing max_num_seqs or max_num_batched_tokens as ways to reduce cache pressure.[1]
Do not turn a memory-utilization fraction into a universal recommendation. Reserve room according to the exact model, execution mode, co-tenancy, and worst supported request. A configuration that boots is not a capacity test.
Chunked prefill negotiates between two latency budgets
Prefill processes the prompt; decode generates subsequent tokens.[2] vLLM's optimization guide describes prefill as compute-bound and decode as memory-bound, and explains how chunked prefill mixes smaller prefill pieces with decode work.[1] Those descriptions explain the scheduling opportunity, but profiling should still establish the bottleneck for the workload being operated.
In V1, chunked prefill is enabled by default whenever possible.[1] The documented policy schedules pending decodes first, then uses the remaining max_num_batched_tokens budget for prefills, splitting a prefill when it does not fit.[1] This is a token budget, not a promise that every prefill chunk has one permanent size.
The tradeoff is explicit. Smaller budgets can improve inter-token latency because less prefill work delays decode; larger budgets can improve time to first token by processing more prompt tokens per batch.[1] A recommendation that claims both tails always improve conceals which workload paid for the gain.

Figure 2. Decode-first scheduling allocates remaining token budget to prefill. Smaller budgets favor inter-token latency; larger budgets can favor time to first token. Measure both under the same offered load. Original conceptual illustration based on vLLM's tuning guidance.[1]
For interactive traffic, define the acceptable gap between streamed outputs separately from the wait for the first output. An output event can contain multiple tokens under speculative decoding, so its gap is not necessarily a per-token delay.[7] For document analysis, retain the longest supported prompts in the test. A configuration selected from short prompts alone has not passed the workload that creates prefill interference.
Sweep the budget while holding the request trace constant. Inspect time to first token and inter-token latency by prompt-length bucket, including tails. Reject a result that makes established streams smoother by leaving new requests waiting beyond their objective. Equally, reject an apparent first-token win that creates visibly stalled streams.
Prefix reuse and speculation solve different problems
Automatic prefix caching reuses cached attention state when a new query shares a prefix with an earlier query.[5] It skips the shared prefill computation; it does not accelerate generation of new tokens.[5] Repeated system prompts are therefore a reason to test reuse, not a reason to promise faster decode.
Use representative rendered prompts when testing cache benefit. Include cold-cache runs and requests that do not share prefixes. Record the engine's reported reuse and the actual first-token improvement. Otherwise a warm benchmark can become a capacity assumption that disappears after restart or a prompt change.
Speculative decoding deserves its own experiment. vLLM's documentation frames it as a way to reduce inter-token latency for memory-bound workloads at medium-to-low request rates, and says gains depend on the model family, hardware, traffic, and sampling settings.[6] Its method-selection guidance also includes potential high-load benefits, so “latency only, never throughput” is too broad a rule.[6]
Test speculation against the same service objective as the baseline. Measure accepted draft progress, resource use, and end-to-end results together. Do not set a universal acceptance-rate threshold and call the decision finished: the cost of proposing and verifying work belongs in the comparison.
Keep weight or cache precision changes in separate experiments. If a candidate uses a different representation, require a task-quality evaluation as well as the performance run. A serving optimization should not quietly change what counts as an acceptable answer.
The host can leave the accelerator waiting
The V1 architecture report explains why host work matters: request state, scheduling, input preparation, detokenization, and response streaming all consume CPU time around model execution.[3] Current optimization documentation warns that CPU underprovisioning can degrade throughput and latency even when the GPU looks underused.[1]
That breaks the tempting diagnosis that low GPU utilization necessarily means bad batching. Check the path before the device: incoming requests, tokenization, scheduler activity, and output handling. Compare server-side timings with the client's view so transport or client bottlenecks do not become imaginary GPU constraints.
The V1 alpha report claimed up to 1.7× throughput relative to V0 without multi-step scheduling, attributing improvements largely to reduced CPU overhead.[3] That is a historical architecture comparison. It is not an additional multiplier to stack onto Anyscale's earlier results, and its alpha-era feature limitations should not be read as today's support matrix.
For each run, save the engine version and full configuration with the model revision, tokenizer, driver, and hardware identity. Save the benchmark client version and documentation retrieval date too. Verify that the chosen speculation method and feature combination are supported by the installed release. Record which optimizations actually activated in startup logs. Documentation defaults are a starting hypothesis; the running process is the thing being measured.
Use goodput as the purchase gate
Define goodput for the evaluation as completed logical requests per second that satisfy the agreed latency and quality requirements, counting each logical request once. Report ordinary throughput beside it, in requests per second and output tokens per second. This is a proposed operating definition, not a benchmark result.
Use a fixed arrival window and fixed drain period for every candidate. Follow that arrival cohort until completion or its deadline; count requests still unfinished when the drain ends as failures. Divide qualifying completions by the combined arrival-window and drain duration. Rejected, timed-out, cancelled and unfinished requests contribute no goodput. Keep them in the offered-request count when reporting the qualifying fraction and failure rate. Count logical requests and retry attempts separately, and report client abandonment even if the server later finishes the work.
Build the test in a controlled sequence:
- Establish the baseline. Use the intended model and a representative request trace, including arrival timestamps. Replay arrivals independently of response completion and verify that the generator sustains them. Record scheduled arrivals, actual dispatches, client-side queueing, concurrency caps, deadlines and retry policy; label response-paced tests separately. Keep sampling settings, stop conditions, chat templates and output-token caps fixed, and report actual output lengths. Separate warm-up from measurement. Include quiet periods and bursts rather than measuring only an indefinitely saturated queue.
- Identify the constraint. Correlate queue delay with host load, cache pressure, preemptions, and device activity. Select one hypothesis before changing a setting.
- Change one mechanism. Evaluate token budget, active-sequence limit, prefix reuse, or speculation independently where possible. Keep any precision change paired with its quality gate.
- Find the service boundary. Increase offered load until the agreed objectives fail. Record failures, cancellation behavior, and recovery after the burst subsides.
- Repeat the candidate. Retest after restart and on the difficult request buckets. Keep the old configuration available for rollback.
Report client-observed time to first streamed output (TTFT, milliseconds), gaps between successive streamed outputs (ITL, milliseconds), per-request time per output token excluding the first token (TPOT, milliseconds per token), and end-to-end latency (seconds).[7] For requests with more than one output token, TPOT = (end-to-end latency − TTFT) / (output tokens − 1).[8] Report both ITL and TPOT when speculative decoding can bundle tokens into one output event.[7]
State the measurement boundaries and percentile populations: TTFT, TPOT and end-to-end latency are request-level distributions; ITL is an output-event-gap distribution.[7][8] For zero- or one-output-token requests, document how the measurement tool handles TPOT; current vLLM server histograms record zero while its benchmark descriptive statistics exclude those requests.[8] Report sample counts by prompt-length bucket and do not average percentile summaries across buckets or runs. Add offered and completed request rates, output token throughput, error rate and preemption counts. Label the observation window and cache state.
Choose acceptance criteria before inspecting the winning run. Report the fraction of offered logical requests meeting all request-level latency requirements together. State whether quality is checked for each request or used as a separate gate on the candidate configuration. For candidate-level quality testing, report latency-qualified goodput and the separate quality result rather than implying every request was checked. A candidate should increase goodput at the intended traffic mix without breaching that quality gate or consuming the headroom required for recovery. If a longer queue merely postpones errors until clients time out, reject it as a capacity improvement.
Consider additional GPUs when repeatable tests identify an accelerator-capacity or model-memory constraint and show that the proposed replica or sharding topology addresses the service objective. Replicas and shards solve different problems, and parallelism can add communication costs.[1] Keep model-fit and availability provisioning separate from this tuning sequence. A CPU, transport or single-request latency limit needs its own diagnosis; additional replicas are not a universal remedy.
A scheduler earns its place by moving useful requests through the service, not by making a utilization display look expensive. The purchase decision belongs at the end of that measurement, after the request path has explained what is actually missing.
Sources
[1] https://docs.vllm.ai/en/stable/configuration/optimization
[2] https://www.anyscale.com/blog/continuous-batching-llm-inference
[3] https://vllm.ai/blog/2025-01-27-v1-alpha-release
[4] https://blog.vllm.ai/2023/06/20/vllm.html
[5] https://docs.vllm.ai/en/stable/features/automatic_prefix_caching
[6] https://docs.vllm.ai/en/latest/features/speculative_decoding
[7] https://docs.vllm.ai/en/stable/benchmarking/cli
[8] https://docs.vllm.ai/en/stable/design/metrics
Until next time, protect yourselves and safeguard each other
Share this article
Comments
Comments are powered by GitHub Discussions via Giscus.
To enable comments, configure Giscus at giscus.app and update the Comments component with your repo settings.